Overview
This guide explains how to set up alerts on any visualization in the dashboards. Alerts help you monitor specific conditions and receive notifications when certain thresholds are met.
Set Up an Alert on a Visualization
Consider an example scenario where you want to be notified when the number of leads in the “City of Beverly Hills” agency exceeds 50 in the Leads dashboard. You can apply similar steps for other visualizations, like categories or types.
Step 1: Locate the Visualization
- Identify the table or chart where you want to create an alert.
- Hover over the visualization. You will see a bell icon appear.
Step 2: Open the Alert Model
- Click the bell icon.
- A modal window will open where you can configure your alert.
Figure 1: Alert modal window
Step 3: Configure Alert Title
- At the top of the modal, enter a descriptive title for your alert.
Example: City of Beverly Hills Leads > 50 - Looker may also provide suggested titles based on your condition.

Figure 2: Naming an alert
Step 4: Set the Condition
- Click the Condition dropdown.
- Select the relevant metric or field:
- Leads Table: Choose Rows Trigger (alerts based on the number of rows).
- Agencies Chart: Choose the specific agency (e.g., City of Beverly Hills).
- Categories Chart: Choose the specific category.
- Types Chart: Choose the specific bid type.
- Choose an operator from the dropdown: is greater than, is less than, is equal to, is greater than or equal to, is less than or equal to.
- Enter the threshold value (e.g., 50).

Figure 3: Applying alert conditions
Note: For maps, alerts cannot be created unless the visualization contains at least one numeric measure or table calculation.
Step 5: Choose Alert Method
- From the Method dropdown, select how you want to receive notifications (e.g., Email).
- Add recipients by entering their email addresses. You can add multiple emails as well.
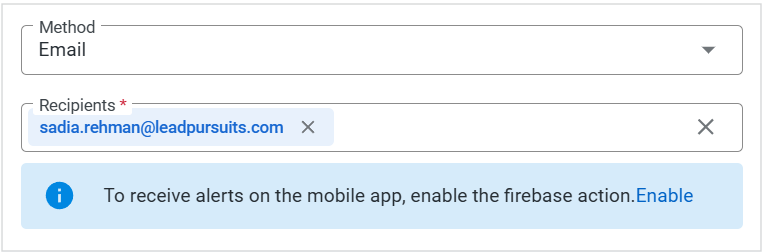
Figure 4: Alert Method and Recipients
Note: Mobile app alerts via Firebase are not currently available.
Step 6: Set Frequency and Time
- From the Frequency dropdown, select how often you want to receive the alert: Hourly, Daily, Weekly, or Monthly.
- Specify the time for the alert if applicable (e.g., 3:00 PM every Wednesday).

Figure 5: Setting Alert Frequency
Step 7: Save the Alert
- Click Save Alert.
- The modal will update to display your alert, including:
- Alert title
- Owner
- Frequency
- Filters applied

Figure 7: Saving Alert
Step 8: Manage Alerts
- Click the three-dot menu next to your alert to:
- Edit Alert – Modify existing conditions.
- Duplicate – Create a copy of the alert.
- Delete – Remove the alert.
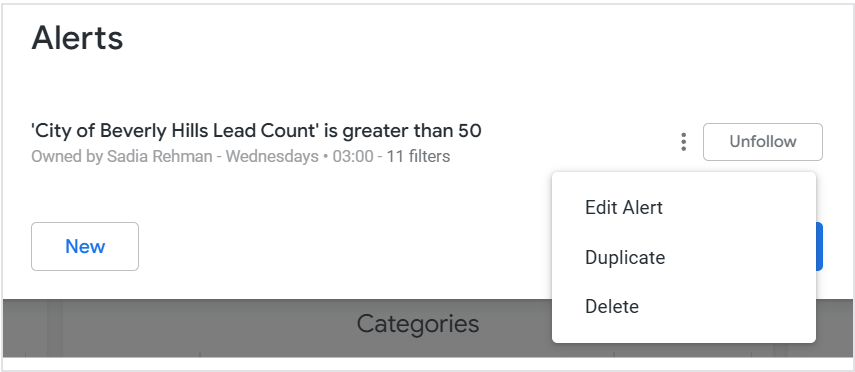
Figure 8: Alert options
- Click Unfollow to deactivate the alert without deleting it. To reactivate an alert, click Follow again.
- Click Done to close the modal and return to the Leads Dashboard.
Note: Click New to create another alert for the same visualization.
For further insight on alert behavior within Looker, refer to Looker: Creating Alerts.
FAQs
Can I create alerts for individual leads?
No. Alerts can only be created on visualizations that include numeric measures or row counts, such as tables and bar charts.
Why can’t I set up an alert on the map visualization?
Map visualizations do not support alerts because they do not include a numeric measure or table calculation. At least one numeric value is required to configure an alert.
What is the difference between “Rows Trigger” and “Lead Count”?
Rows Trigger is used for table visualizations and triggers an alert based on the number of rows returned. Lead Count is used in chart visualizations and triggers an alert based on the numeric count of leads for a specific agency, category, or bid type.
Contact Us
For further assistance, Contact Us.